# 分析概览 (/zh/analytics)

<!-- agent-signals: reading_time_min: 3 · est_tokens: 2035 · updated: 2026-09-23 -->

<Info>
  分析功能需要 [Pro 或 Enterprise 套餐](https://mintlify.com/pricing?ref=analytics)。
</Info>

dashboard 中的[分析](https://app.mintlify.com/analytics)页面展示了访客和智能体如何发现和使用您的文档。利用这些信号识别高价值页面、发现内容缺口,并跟踪随时间的变化。

<Tip>
  直接在聊天面板中向[智能体](/zh/editor/agent#ask-about-your-analytics)询问关于分析数据的问题。智能体可以回答有关这些数据的问题,并就如何改进文档提供见解。
</Tip>

分析数据通常会在交互发生后几分钟内出现。最近发生的事件可能不会立即显示。

<div id="choose-an-analytics-view">
  ## 选择分析视图 [#选择分析视图]
</div>

<Card title="流量" icon="<svg xmlns=&#x22;http://www.w3.org/2000/svg&#x22; viewBox=&#x22;0 0 24 24&#x22; fill=&#x22;none&#x22;><path d=&#x22;M7 15.2461L9.87381 11.5319C10.1242 11.2082 10.2495 11.0464 10.3862 10.9354C10.7975 10.6017 11.3471 10.5135 11.8368 10.7026C11.9997 10.7654 12.1664 10.8804 12.5 11.1103C12.8336 11.3402 13.0003 11.4552 13.1632 11.518C13.6529 11.7071 14.2025 11.6189 14.6138 11.2852C14.7505 11.1742 14.8757 11.0124 15.1262 10.6887L15.9061 9.68068C16.8833 8.41772 17.3719 7.78624 18.0414 7.7479C18.7109 7.70956 19.264 8.28139 20.3701 9.42505L21 10.0764&#x22; stroke=&#x22;currentColor&#x22; stroke-linecap=&#x22;round&#x22; stroke-linejoin=&#x22;round&#x22; stroke-width=&#x22;1.5&#x22;/><path d=&#x22;M21 21H10C6.70017 21 5.05025 21 4.02513 19.9749C3 18.9497 3 17.2998 3 14V3&#x22; stroke=&#x22;currentColor&#x22; stroke-linecap=&#x22;round&#x22; stroke-width=&#x22;1.5&#x22;/></svg>" href="/zh/analytics/traffic">
  跟踪访客、页面浏览量、引荐来源以及来自人类和 agent 的流量。
</Card>

<Card title="助手" icon="<svg xmlns=&#x22;http://www.w3.org/2000/svg&#x22; viewBox=&#x22;0 0 24 24&#x22; fill=&#x22;none&#x22;><path d=&#x22;M8.5 14.5H15.5M8.5 9.5H12&#x22; stroke=&#x22;currentColor&#x22; stroke-linecap=&#x22;round&#x22; stroke-linejoin=&#x22;round&#x22; stroke-width=&#x22;1.5&#x22;/><path d=&#x22;M14.1706 20.8905C18.3536 20.6125 21.6856 17.2332 21.9598 12.9909C22.0134 12.1607 22.0134 11.3009 21.9598 10.4707C21.6856 6.22838 18.3536 2.84913 14.1706 2.57107C12.7435 2.47621 11.2536 2.47641 9.8294 2.57107C5.64639 2.84913 2.31441 6.22838 2.04024 10.4707C1.98659 11.3009 1.98659 12.1607 2.04024 12.9909C2.1401 14.536 2.82343 15.9666 3.62791 17.1746C4.09501 18.0203 3.78674 19.0758 3.30021 19.9978C2.94941 20.6626 2.77401 20.995 2.91484 21.2351C3.05568 21.4752 3.37026 21.4829 3.99943 21.4982C5.24367 21.5285 6.08268 21.1757 6.74868 20.6846C7.1264 20.4061 7.31527 20.2668 7.44544 20.2508C7.5756 20.2348 7.83177 20.3403 8.34401 20.5513C8.8044 20.7409 9.33896 20.8579 9.8294 20.8905C11.2536 20.9852 12.7435 20.9854 14.1706 20.8905Z&#x22; stroke=&#x22;currentColor&#x22; stroke-linejoin=&#x22;round&#x22; stroke-width=&#x22;1.5&#x22;/></svg>" href="/zh/analytics/assistant">
  查看助手使用情况、对话主题、满意度和记录。
</Card>

<Card title="搜索" icon="<svg xmlns=&#x22;http://www.w3.org/2000/svg&#x22; viewBox=&#x22;0 0 24 24&#x22; fill=&#x22;none&#x22;><path d=&#x22;M17 17L21 21&#x22; stroke=&#x22;currentColor&#x22; stroke-linecap=&#x22;round&#x22; stroke-linejoin=&#x22;round&#x22; stroke-width=&#x22;1.5&#x22;/><path d=&#x22;M19 11C19 6.58172 15.4183 3 11 3C6.58172 3 3 6.58172 3 11C3 15.4183 6.58172 19 11 19C15.4183 19 19 15.4183 19 11Z&#x22; stroke=&#x22;currentColor&#x22; stroke-linecap=&#x22;round&#x22; stroke-linejoin=&#x22;round&#x22; stroke-width=&#x22;1.5&#x22;/></svg>" href="/zh/analytics/search">
  分析搜索量、常见查询和点击率。
</Card>

<Card title="用户参与" icon="<svg xmlns=&#x22;http://www.w3.org/2000/svg&#x22; viewBox=&#x22;0 0 24 24&#x22; fill=&#x22;none&#x22;><circle cx=&#x22;18&#x22; cy=&#x22;5&#x22; r=&#x22;3&#x22; stroke=&#x22;currentColor&#x22; stroke-linecap=&#x22;round&#x22; stroke-linejoin=&#x22;round&#x22; stroke-width=&#x22;1.5&#x22;/><circle cx=&#x22;6&#x22; cy=&#x22;19&#x22; r=&#x22;3&#x22; stroke=&#x22;currentColor&#x22; stroke-linecap=&#x22;round&#x22; stroke-linejoin=&#x22;round&#x22; stroke-width=&#x22;1.5&#x22;/><path d=&#x22;M12 5H8.5C6.567 5 5 6.567 5 8.5C5 10.433 6.567 12 8.5 12H15.5C17.433 12 19 13.567 19 15.5C19 17.433 17.433 19 15.5 19H12&#x22; stroke=&#x22;currentColor&#x22; stroke-linecap=&#x22;round&#x22; stroke-linejoin=&#x22;round&#x22; stroke-width=&#x22;1.5&#x22;/></svg>" href="/zh/analytics/user-engagements">
  了解内容操作、导航路径,以及搜索和助手漏斗。
</Card>

<Card title="反馈" icon="<svg xmlns=&#x22;http://www.w3.org/2000/svg&#x22; viewBox=&#x22;0 0 24 24&#x22; fill=&#x22;none&#x22;><path d=&#x22;M6.99892 9.5C6.75828 7.50503 7.91475 7.09687 11.9989 7M11.9989 7C16.1223 7.10058 17.3402 7.59829 16.9989 9.5M11.9989 7V17M9.99892 17H13.9989&#x22; stroke=&#x22;currentColor&#x22; stroke-linecap=&#x22;round&#x22; stroke-linejoin=&#x22;round&#x22; stroke-width=&#x22;1.5&#x22;/><path d=&#x22;M3.89124 3.89124C2.5 5.28249 2.5 7.52166 2.5 12C2.5 16.4783 2.5 18.7175 3.89124 20.1088C5.28249 21.5 7.52166 21.5 12 21.5C16.4783 21.5 18.7175 21.5 20.1088 20.1088C21.5 18.7175 21.5 16.4783 21.5 12C21.5 7.52166 21.5 5.28249 20.1088 3.89124C18.7175 2.5 16.4783 2.5 12 2.5C7.52166 2.5 5.28249 2.5 3.89124 3.89124Z&#x22; stroke=&#x22;currentColor&#x22; stroke-linecap=&#x22;round&#x22; stroke-linejoin=&#x22;round&#x22; stroke-width=&#x22;1.5&#x22;/></svg>" href="/zh/optimize/feedback">
  查看随时间变化的反馈、审阅特定评分和书面反馈,并跟踪后续工作。
</Card>

<Card title="导出分析" icon="<svg xmlns=&#x22;http://www.w3.org/2000/svg&#x22; viewBox=&#x22;0 0 24 24&#x22; fill=&#x22;none&#x22;><path d=&#x22;M13 2.5V3C13 5.82843 13 7.24264 13.8787 8.12132C14.7574 9 16.1716 9 19 9H19.5M20 10.6569V14C20 17.7712 20 19.6569 18.8284 20.8284C17.6569 22 15.7712 22 12 22C8.22876 22 6.34315 22 5.17157 20.8284C4 19.6569 4 17.7712 4 14V9.45584C4 6.21082 4 4.58831 4.88607 3.48933C5.06508 3.26731 5.26731 3.06508 5.48933 2.88607C6.58831 2 8.21082 2 11.4558 2C12.1614 2 12.5141 2 12.8372 2.11401C12.9044 2.13772 12.9702 2.165 13.0345 2.19575C13.3436 2.34355 13.593 2.593 14.0919 3.09188L18.8284 7.82843C19.4065 8.40649 19.6955 8.69552 19.8478 9.06306C20 9.4306 20 9.83935 20 10.6569Z&#x22; stroke=&#x22;currentColor&#x22; stroke-linecap=&#x22;round&#x22; stroke-linejoin=&#x22;round&#x22; stroke-width=&#x22;1.5&#x22;/><path d=&#x22;M8 16V18&#x22; stroke=&#x22;currentColor&#x22; stroke-linecap=&#x22;round&#x22; stroke-linejoin=&#x22;round&#x22; stroke-width=&#x22;1.5&#x22;/><path d=&#x22;M12 13V18&#x22; stroke=&#x22;currentColor&#x22; stroke-linecap=&#x22;round&#x22; stroke-linejoin=&#x22;round&#x22; stroke-width=&#x22;1.5&#x22;/><path d=&#x22;M16 15V18&#x22; stroke=&#x22;currentColor&#x22; stroke-linecap=&#x22;round&#x22; stroke-linejoin=&#x22;round&#x22; stroke-width=&#x22;1.5&#x22;/></svg>" href="/zh/analytics/export">
  将 dashboard 数据导出为 CSV,用于分析、报告或归档。
</Card>

<Card title="流式传输分析事件" icon="<svg xmlns=&#x22;http://www.w3.org/2000/svg&#x22; viewBox=&#x22;0 0 24 24&#x22; fill=&#x22;none&#x22;><ellipse cx=&#x22;12&#x22; cy=&#x22;5&#x22; rx=&#x22;8&#x22; ry=&#x22;3&#x22; stroke=&#x22;currentColor&#x22; stroke-width=&#x22;1.5&#x22;/><path d=&#x22;M7 10.842C7.60158 11.0229 8.27434 11.1718 9 11.282&#x22; stroke=&#x22;currentColor&#x22; stroke-linecap=&#x22;round&#x22; stroke-width=&#x22;1.5&#x22;/><path d=&#x22;M20 12C20 13.6569 16.4183 15 12 15C7.58172 15 4 13.6569 4 12&#x22; stroke=&#x22;currentColor&#x22; stroke-width=&#x22;1.5&#x22;/><path d=&#x22;M7 17.842C7.60158 18.0229 8.27434 18.1718 9 18.282&#x22; stroke=&#x22;currentColor&#x22; stroke-linecap=&#x22;round&#x22; stroke-width=&#x22;1.5&#x22;/><path d=&#x22;M20 5V19C20 20.6569 16.4183 22 12 22C7.58172 22 4 20.6569 4 19V5&#x22; stroke=&#x22;currentColor&#x22; stroke-width=&#x22;1.5&#x22;/></svg>" href="/zh/analytics/streaming">
  将分析事件发送到 Amazon S3 以进行下游处理。
</Card>

<div id="filter-by-time-period">
  ## 按时间段筛选 [#按时间段筛选]
</div>

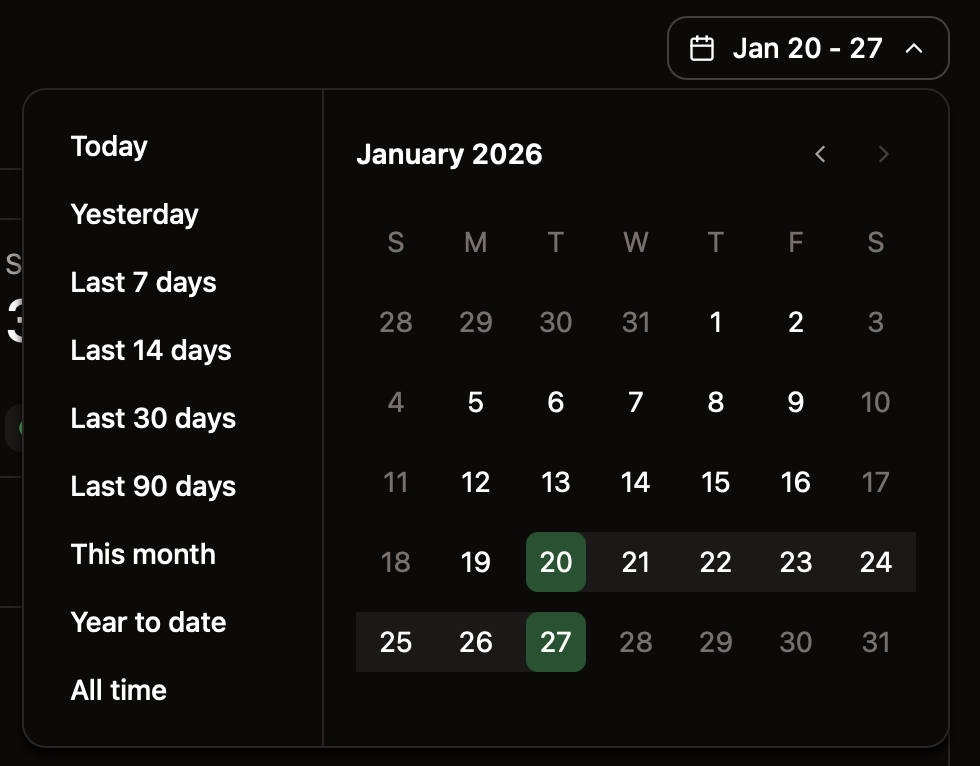
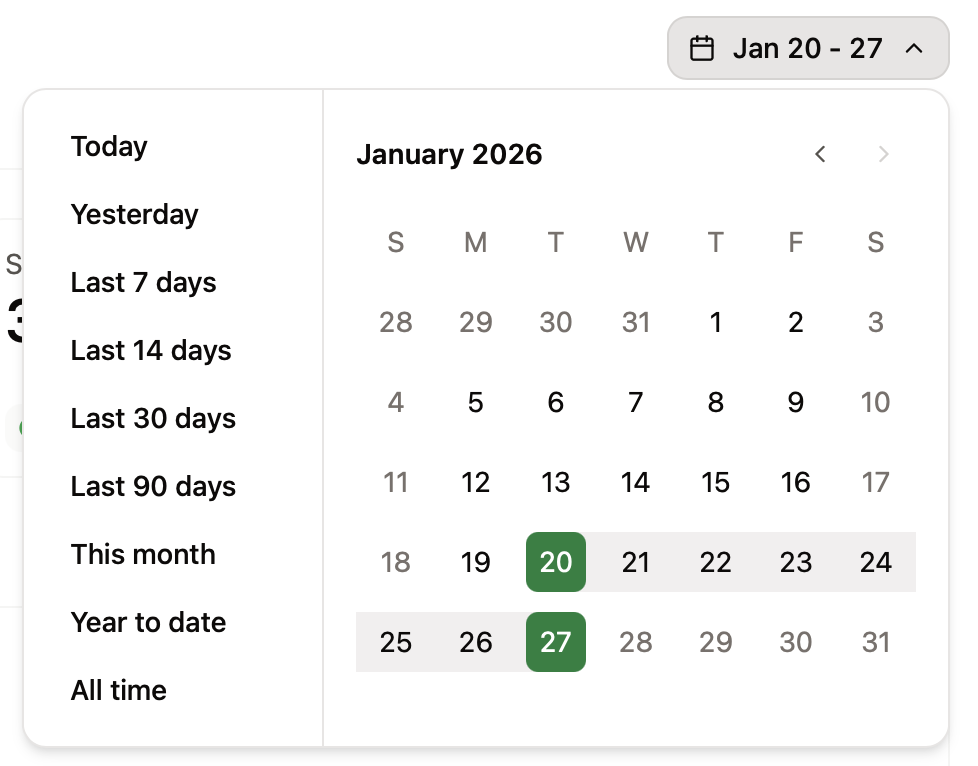
在分析视图中使用范围选择器调整所显示数据的时间段。导出也会使用所选的时间范围。
<Frame>
  <img src="/_assets/3e686489a0add5601f5569bfb7abeaaf1663ac59b7e7236dcc1065c6eed26ae1" alt="展开的范围选择器,显示查看不同时间段数据的选项。" className="block dark:hidden" />

  <img src="/_assets/1bc73f92d3426430cb7a575be899cf4bdfc86ecc4bf0b009fd2c8b0ecc159256" alt="展开的范围选择器,显示查看不同时间段数据的选项。" className="hidden dark:block" />
</Frame>

<div id="filter-by-page-or-path">
  ## 按页面或路径筛选 [#按页面或路径筛选]
</div>

使用 **Filter** 菜单可将仪表板范围限定为单个页面或路径。当您选择一个路径时,分析页面会显示该路径下每个路径的数据。例如,如果您筛选到 `docs/authentication`,分析页面会显示 `docs/authentication/*` 路径下每个页面的数据。Assistant 和 Search 视图始终显示站点范围的数据。

在 Traffic 视图中,按页面筛选会将热门页面排名的起点更改为所选页面,并沿排名向下延续,而不是仅显示该页面。