# Analytics overview (/analytics)

<!-- agent-signals: reading_time_min: 4 · est_tokens: 2337 · updated: 2026-09-23 -->
Related: [What is the agent?](/agent.md), [Assistant](/assistant.md), [Automations overview](/automations.md), [Mintlify CLI](/cli.md), [Components overview](/components.md), [Editor overview](/editor.md)

<Info>
  Analytics require a [Pro or Enterprise plan](https://mintlify.com/pricing?ref=analytics).
</Info>

The [analytics](https://app.mintlify.com/analytics) page in your dashboard shows how visitors and agents find and use your documentation. Use these signals to identify valuable pages, discover content gaps, and track changes over time.

<Tip>
  Ask the [agent](/editor/agent#ask-about-your-analytics) questions about your analytics data directly in the chat panel. The agent can answer questions about the data and provide insights on how to improve your documentation.
</Tip>

Analytics data typically appears within a few minutes of an interaction. Very recent events might not appear immediately.

## Select an analytics view [#select-an-analytics-view]

<Card title="Traffic" icon="<svg xmlns=&#x22;http://www.w3.org/2000/svg&#x22; viewBox=&#x22;0 0 24 24&#x22; fill=&#x22;none&#x22;><path d=&#x22;M7 15.2461L9.87381 11.5319C10.1242 11.2082 10.2495 11.0464 10.3862 10.9354C10.7975 10.6017 11.3471 10.5135 11.8368 10.7026C11.9997 10.7654 12.1664 10.8804 12.5 11.1103C12.8336 11.3402 13.0003 11.4552 13.1632 11.518C13.6529 11.7071 14.2025 11.6189 14.6138 11.2852C14.7505 11.1742 14.8757 11.0124 15.1262 10.6887L15.9061 9.68068C16.8833 8.41772 17.3719 7.78624 18.0414 7.7479C18.7109 7.70956 19.264 8.28139 20.3701 9.42505L21 10.0764&#x22; stroke=&#x22;currentColor&#x22; stroke-linecap=&#x22;round&#x22; stroke-linejoin=&#x22;round&#x22; stroke-width=&#x22;1.5&#x22;/><path d=&#x22;M21 21H10C6.70017 21 5.05025 21 4.02513 19.9749C3 18.9497 3 17.2998 3 14V3&#x22; stroke=&#x22;currentColor&#x22; stroke-linecap=&#x22;round&#x22; stroke-width=&#x22;1.5&#x22;/></svg>" href="/analytics/traffic">
  Track visitors, page views, referrals, and human and agent traffic.
</Card>

<Card title="Assistant" icon="<svg xmlns=&#x22;http://www.w3.org/2000/svg&#x22; viewBox=&#x22;0 0 24 24&#x22; fill=&#x22;none&#x22;><path d=&#x22;M8.5 14.5H15.5M8.5 9.5H12&#x22; stroke=&#x22;currentColor&#x22; stroke-linecap=&#x22;round&#x22; stroke-linejoin=&#x22;round&#x22; stroke-width=&#x22;1.5&#x22;/><path d=&#x22;M14.1706 20.8905C18.3536 20.6125 21.6856 17.2332 21.9598 12.9909C22.0134 12.1607 22.0134 11.3009 21.9598 10.4707C21.6856 6.22838 18.3536 2.84913 14.1706 2.57107C12.7435 2.47621 11.2536 2.47641 9.8294 2.57107C5.64639 2.84913 2.31441 6.22838 2.04024 10.4707C1.98659 11.3009 1.98659 12.1607 2.04024 12.9909C2.1401 14.536 2.82343 15.9666 3.62791 17.1746C4.09501 18.0203 3.78674 19.0758 3.30021 19.9978C2.94941 20.6626 2.77401 20.995 2.91484 21.2351C3.05568 21.4752 3.37026 21.4829 3.99943 21.4982C5.24367 21.5285 6.08268 21.1757 6.74868 20.6846C7.1264 20.4061 7.31527 20.2668 7.44544 20.2508C7.5756 20.2348 7.83177 20.3403 8.34401 20.5513C8.8044 20.7409 9.33896 20.8579 9.8294 20.8905C11.2536 20.9852 12.7435 20.9854 14.1706 20.8905Z&#x22; stroke=&#x22;currentColor&#x22; stroke-linejoin=&#x22;round&#x22; stroke-width=&#x22;1.5&#x22;/></svg>" href="/analytics/assistant">
  Review assistant usage, conversation topics, satisfaction, and transcripts.
</Card>

<Card title="Search" icon="<svg xmlns=&#x22;http://www.w3.org/2000/svg&#x22; viewBox=&#x22;0 0 24 24&#x22; fill=&#x22;none&#x22;><path d=&#x22;M17 17L21 21&#x22; stroke=&#x22;currentColor&#x22; stroke-linecap=&#x22;round&#x22; stroke-linejoin=&#x22;round&#x22; stroke-width=&#x22;1.5&#x22;/><path d=&#x22;M19 11C19 6.58172 15.4183 3 11 3C6.58172 3 3 6.58172 3 11C3 15.4183 6.58172 19 11 19C15.4183 19 19 15.4183 19 11Z&#x22; stroke=&#x22;currentColor&#x22; stroke-linecap=&#x22;round&#x22; stroke-linejoin=&#x22;round&#x22; stroke-width=&#x22;1.5&#x22;/></svg>" href="/analytics/search">
  Analyze search volume, frequent queries, and click-through rates.
</Card>

<Card title="User engagements" icon="<svg xmlns=&#x22;http://www.w3.org/2000/svg&#x22; viewBox=&#x22;0 0 24 24&#x22; fill=&#x22;none&#x22;><circle cx=&#x22;18&#x22; cy=&#x22;5&#x22; r=&#x22;3&#x22; stroke=&#x22;currentColor&#x22; stroke-linecap=&#x22;round&#x22; stroke-linejoin=&#x22;round&#x22; stroke-width=&#x22;1.5&#x22;/><circle cx=&#x22;6&#x22; cy=&#x22;19&#x22; r=&#x22;3&#x22; stroke=&#x22;currentColor&#x22; stroke-linecap=&#x22;round&#x22; stroke-linejoin=&#x22;round&#x22; stroke-width=&#x22;1.5&#x22;/><path d=&#x22;M12 5H8.5C6.567 5 5 6.567 5 8.5C5 10.433 6.567 12 8.5 12H15.5C17.433 12 19 13.567 19 15.5C19 17.433 17.433 19 15.5 19H12&#x22; stroke=&#x22;currentColor&#x22; stroke-linecap=&#x22;round&#x22; stroke-linejoin=&#x22;round&#x22; stroke-width=&#x22;1.5&#x22;/></svg>" href="/analytics/user-engagements">
  Understand content actions, navigation paths, and search and assistant funnels.
</Card>

<Card title="Feedback" icon="<svg xmlns=&#x22;http://www.w3.org/2000/svg&#x22; viewBox=&#x22;0 0 24 24&#x22; fill=&#x22;none&#x22;><path d=&#x22;M6.99892 9.5C6.75828 7.50503 7.91475 7.09687 11.9989 7M11.9989 7C16.1223 7.10058 17.3402 7.59829 16.9989 9.5M11.9989 7V17M9.99892 17H13.9989&#x22; stroke=&#x22;currentColor&#x22; stroke-linecap=&#x22;round&#x22; stroke-linejoin=&#x22;round&#x22; stroke-width=&#x22;1.5&#x22;/><path d=&#x22;M3.89124 3.89124C2.5 5.28249 2.5 7.52166 2.5 12C2.5 16.4783 2.5 18.7175 3.89124 20.1088C5.28249 21.5 7.52166 21.5 12 21.5C16.4783 21.5 18.7175 21.5 20.1088 20.1088C21.5 18.7175 21.5 16.4783 21.5 12C21.5 7.52166 21.5 5.28249 20.1088 3.89124C18.7175 2.5 16.4783 2.5 12 2.5C7.52166 2.5 5.28249 2.5 3.89124 3.89124Z&#x22; stroke=&#x22;currentColor&#x22; stroke-linecap=&#x22;round&#x22; stroke-linejoin=&#x22;round&#x22; stroke-width=&#x22;1.5&#x22;/></svg>" href="/optimize/feedback">
  View feedback over time, review specific ratings and written feedback, and track follow-up work.
</Card>

<Card title="Export analytics" icon="<svg xmlns=&#x22;http://www.w3.org/2000/svg&#x22; viewBox=&#x22;0 0 24 24&#x22; fill=&#x22;none&#x22;><path d=&#x22;M13 2.5V3C13 5.82843 13 7.24264 13.8787 8.12132C14.7574 9 16.1716 9 19 9H19.5M20 10.6569V14C20 17.7712 20 19.6569 18.8284 20.8284C17.6569 22 15.7712 22 12 22C8.22876 22 6.34315 22 5.17157 20.8284C4 19.6569 4 17.7712 4 14V9.45584C4 6.21082 4 4.58831 4.88607 3.48933C5.06508 3.26731 5.26731 3.06508 5.48933 2.88607C6.58831 2 8.21082 2 11.4558 2C12.1614 2 12.5141 2 12.8372 2.11401C12.9044 2.13772 12.9702 2.165 13.0345 2.19575C13.3436 2.34355 13.593 2.593 14.0919 3.09188L18.8284 7.82843C19.4065 8.40649 19.6955 8.69552 19.8478 9.06306C20 9.4306 20 9.83935 20 10.6569Z&#x22; stroke=&#x22;currentColor&#x22; stroke-linecap=&#x22;round&#x22; stroke-linejoin=&#x22;round&#x22; stroke-width=&#x22;1.5&#x22;/><path d=&#x22;M8 16V18&#x22; stroke=&#x22;currentColor&#x22; stroke-linecap=&#x22;round&#x22; stroke-linejoin=&#x22;round&#x22; stroke-width=&#x22;1.5&#x22;/><path d=&#x22;M12 13V18&#x22; stroke=&#x22;currentColor&#x22; stroke-linecap=&#x22;round&#x22; stroke-linejoin=&#x22;round&#x22; stroke-width=&#x22;1.5&#x22;/><path d=&#x22;M16 15V18&#x22; stroke=&#x22;currentColor&#x22; stroke-linecap=&#x22;round&#x22; stroke-linejoin=&#x22;round&#x22; stroke-width=&#x22;1.5&#x22;/></svg>" href="/analytics/export">
  Export dashboard data to CSV for analysis, reporting, or archival.
</Card>

<Card title="Stream analytics events" icon="<svg xmlns=&#x22;http://www.w3.org/2000/svg&#x22; viewBox=&#x22;0 0 24 24&#x22; fill=&#x22;none&#x22;><ellipse cx=&#x22;12&#x22; cy=&#x22;5&#x22; rx=&#x22;8&#x22; ry=&#x22;3&#x22; stroke=&#x22;currentColor&#x22; stroke-width=&#x22;1.5&#x22;/><path d=&#x22;M7 10.842C7.60158 11.0229 8.27434 11.1718 9 11.282&#x22; stroke=&#x22;currentColor&#x22; stroke-linecap=&#x22;round&#x22; stroke-width=&#x22;1.5&#x22;/><path d=&#x22;M20 12C20 13.6569 16.4183 15 12 15C7.58172 15 4 13.6569 4 12&#x22; stroke=&#x22;currentColor&#x22; stroke-width=&#x22;1.5&#x22;/><path d=&#x22;M7 17.842C7.60158 18.0229 8.27434 18.1718 9 18.282&#x22; stroke=&#x22;currentColor&#x22; stroke-linecap=&#x22;round&#x22; stroke-width=&#x22;1.5&#x22;/><path d=&#x22;M20 5V19C20 20.6569 16.4183 22 12 22C7.58172 22 4 20.6569 4 19V5&#x22; stroke=&#x22;currentColor&#x22; stroke-width=&#x22;1.5&#x22;/></svg>" href="/analytics/streaming">
  Send analytics events to Amazon S3 for downstream processing.
</Card>

## Filter by time period [#filter-by-time-period]

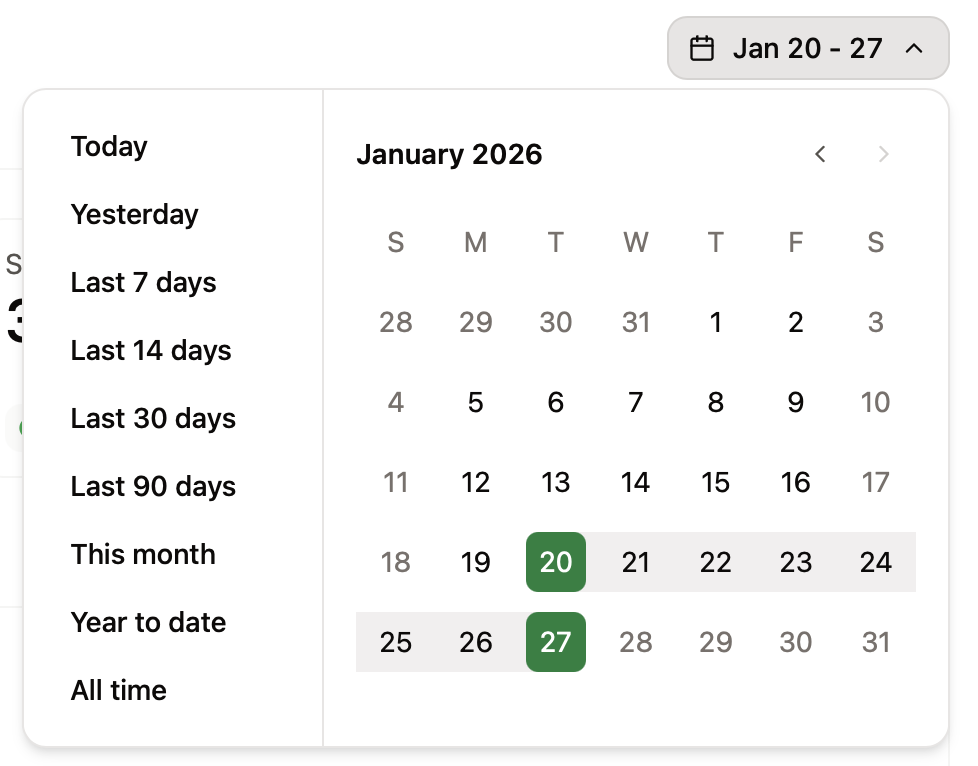
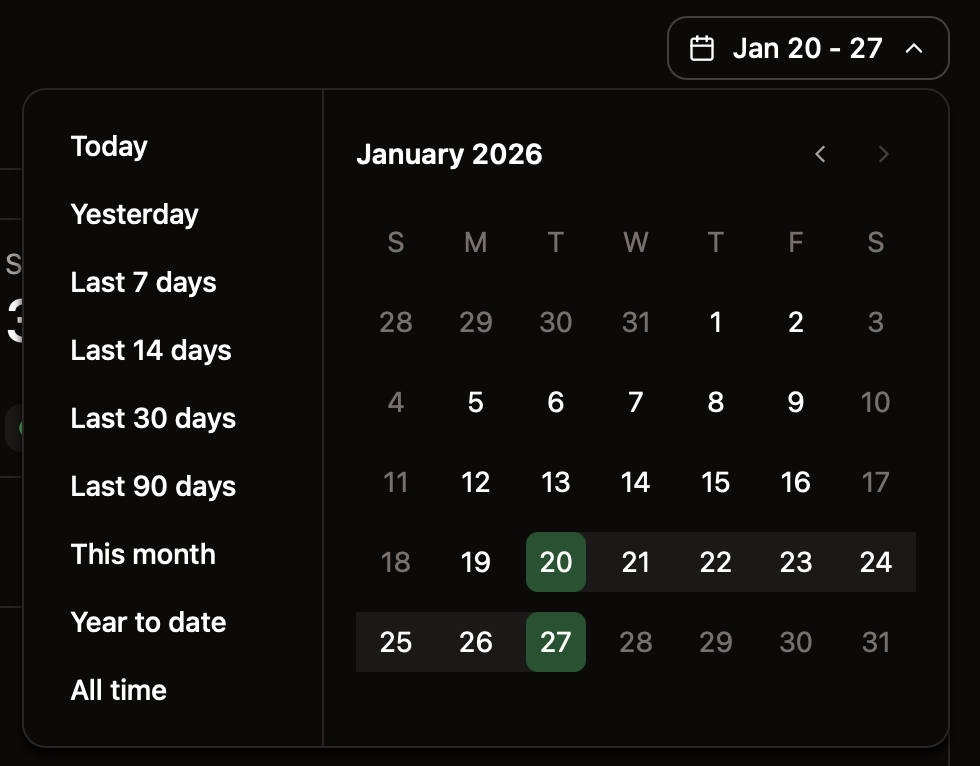
Use the range selector in an analytics view to adjust the time period for the displayed data. Exports also use the selected time range.
<Frame>
  <img src="/_assets/3e686489a0add5601f5569bfb7abeaaf1663ac59b7e7236dcc1065c6eed26ae1" alt="The range selector expanded to show options for viewing different time periods of data." className="block dark:hidden" />

  <img src="/_assets/1bc73f92d3426430cb7a575be899cf4bdfc86ecc4bf0b009fd2c8b0ecc159256" alt="The range selector expanded to show options for viewing different time periods of data." className="hidden dark:block" />
</Frame>

## Filter by page or path [#filter-by-page-or-path]

Use the **Filter** menu to scope the dashboard to a single page or path. When you select a path, the analytics page displays data for every page under that path. For example, if you filter to `docs/authentication`, the analytics page displays data for every page in the `docs/authentication/*` path. The Assistant and Search views always show site-wide data.

In the Traffic view, filtering by page changes the popular pages ranking to start at the selected page and continue down the ranking, rather than showing only that page.
